
Agent Performance Dashboard for Singapore Real Estate Agents

An agent performance dashboard is a centralized, decision-grade display of a focused set of core KPIs that tells new agents and team leaders exactly what to do next. If you are preparing for your RES exam or onboarding with ERA, the single most productive step you can take right now is connecting Sales+ (or your CRM) to a dashboard with the KPIs below, then scheduling weekly coaching alerts with your team leader.
Quick-start essentials:
ERA and Sales+ app: your primary data sources for lead activity, listing progress, and client follow-up
Donny Lee’s leadership pathway: structures the coaching cadence that makes dashboard alerts meaningful
6–12 KPIs only: dashboards with more than 12 metrics slow decisions; fewer than 6 can miss critical signals, so aim for a focused set to keep action speed high.
PDPA considerations: collect only the agent-activity data you need, store it securely, and obtain consent before tracking agent-client interaction logs
Table of Contents
What does an agent performance dashboard actually do for new agents?
How do you implement a dashboard in a Singapore real-estate team?
How ERA and the Sales+ app support your dashboard from day one
What dashboards actually changed about recruiting and onboarding
Ready to build your ERA career with the right tools behind you?
What does an agent performance dashboard actually do for new agents?
A performance dashboard is not a reporting tool. It is a decision tool. It pulls lead contacts, listing activity, client follow-up counts, and response times into one view so that both the agent and the team leader can see, at a glance, where momentum is building and where it is stalling.
For new agents in Singapore, three benefits stand out. First, it speeds coaching: instead of waiting for a monthly review, your team leader sees a trigger alert the moment a KPI crosses a threshold and can intervene within hours. Second, it reinforces the exam-focused behaviors that the CEA requires, because the dashboard makes activity visible and measurable from day one. Third, it protects candidate progress by creating an auditable record of onboarding milestones that aligns with PDPA’s principle of data minimization.
ERA’s Sales+ app feeds directly into this workflow. The app logs outreach attempts, appointment outcomes, and listing presentations, giving the dashboard live inputs without manual entry. A strong dashboard connects every KPI to a named owner and signals when action is required — that is precisely how ERA’s team-leader coaching model operates.
Which KPIs should every agent dashboard include?
Effective dashboards use 6–12 core KPIs segmented across productivity, quality, and efficiency. The table below covers the recommended set for Singapore real-estate agents, with measurement source and owner.
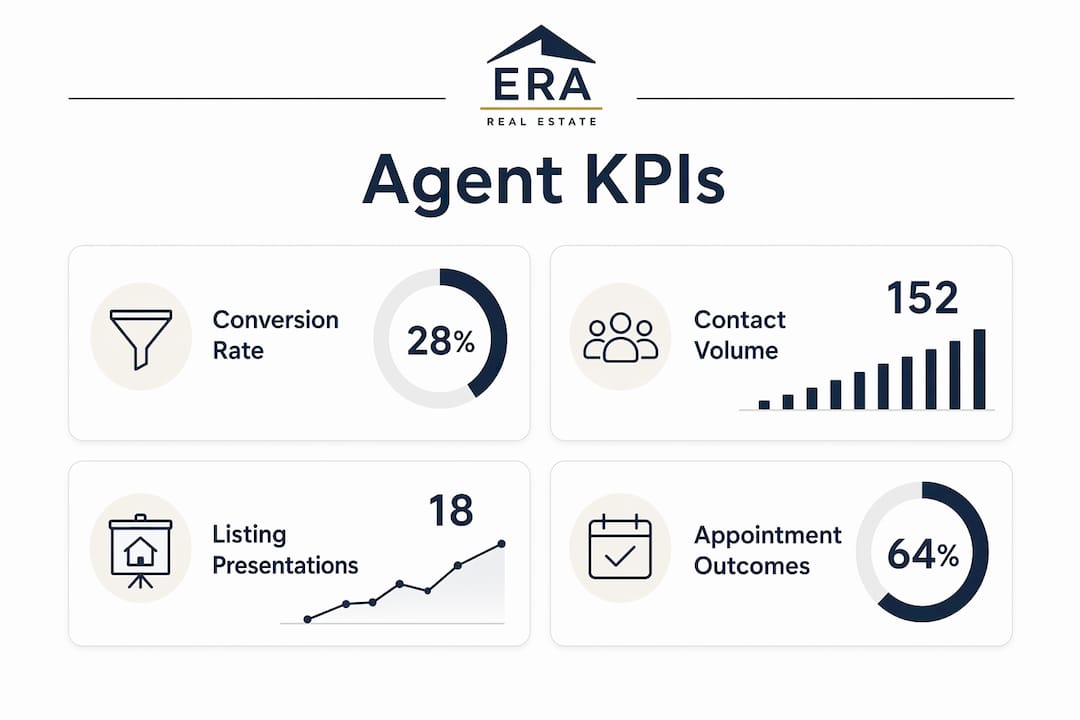
KPI | Unit | Measurement Source | Frequency | Owner |
Lead contacts made | Count | Sales+ / CRM | Daily | Agent |
Appointments set | Count | Sales+ calendar | Daily | Agent |
Listing presentations | Count | CRM activity log | Weekly | Agent |
Lead-to-appointment conversion | % | CRM funnel | Weekly | Team leader |
Client response time | Hours | Email / WhatsApp log | Real-time | Agent |
CSAT / client feedback score | 1–5 scale | Post-transaction survey | Per transaction | Admin |
Contract error rate | % | Document review log | Weekly | Team leader |
Training completion | % | LMS / ERA portal | Weekly | Team leader |
Why each KPI matters for new agents:
Lead contacts made establishes the activity baseline that predicts pipeline health six weeks out
Appointments set is the earliest leading indicator of commission revenue
Listing presentations measures whether outreach is converting to real client engagement
Conversion rate reveals skill gaps that coaching can address before they compound
Client response time directly affects client satisfaction and referral likelihood; commonly tracked alongside CSAT in agent efficiency reports
CSAT score closes the loop between agent behavior and client experience
Contract error rate flags compliance risk early, which matters under CEA’s conduct requirements
Training completion keeps RES exam preparation on track during the onboarding window
Segmenting these KPIs across financial, operational, and customer-related categories, as performance dashboard best practice recommends, prevents over-optimizing one area at the expense of another. For agents who handle rentals, rental-specific KPIs such as inquiry response rate and lease conversion add useful depth.
How do you set baselines, thresholds, and action triggers?
Every metric needs three anchors: a current value, a baseline (your starting point), and a target (your desired state). Without all three, movement is unmeasurable.
Step-by-step checklist:
Choose your baseline. Use your first two weeks of Sales+ data as a personal baseline, or use your team’s cohort average if you are in a group onboarding intake.
Set a realistic target. Agree on the target with your team leader during the first coaching session.
Define warning and critical thresholds. Example: client response time — warning at more than 4 hours, critical at more than 24 hours. Lead contacts — warning below 8 per day, critical below 5.
Map an action to each threshold. Warning triggers a self-review; critical triggers a team-leader coaching call within 24 hours.
Review thresholds monthly. Singapore’s property market has seasonal peaks (typically around major public holidays and school-term starts), so static thresholds produce false alerts during low-traffic weeks.
PDPA-safe data handling: log agent activity data (not client personal data) in Sales+, apply a 12-month retention limit on raw logs, and document consent in your onboarding agreement before enabling any interaction tracking.
Pro Tip: During your first 30 days, set warning thresholds 20% below your target rather than at the target itself. This gives you an early signal before a KPI becomes critical, which is far easier to correct.
What should your dashboard actually look like day to day?
A well-structured agent efficiency report uses three practical views, each serving a different cadence.
Daily operational view (agent-level): shows lead contacts made today, response-time status, and any open trigger alerts. The goal is a 60-second morning check that tells the agent where to focus first.

Weekly coaching view (team-leader-level): trend lines for conversion rate and listing presentations over the past four weeks, plus a side-by-side cohort comparison. Real-time visibility eliminates the lag of manual spreadsheets and lets the team leader spot high performers and bottlenecks immediately.
Training and cohort view (RES exam readiness): training completion percentage, module scores, and days remaining to exam. This view lives at the team-leader level and feeds directly into the weekly coaching agenda.
View | Primary User | Update Frequency | Key Signal |
Daily operational | Agent | Real-time / hourly | Open alerts, response time |
Weekly coaching | Team leader | Weekly | Conversion trend, cohort rank |
Training / cohort | Team leader | Weekly | Training completion %, exam timeline |
One interpretation principle worth internalizing: read movement before volume. A conversion rate dropping from 30% to 22% over three weeks is more actionable than a single week at 18%, because the trend reveals a pattern rather than a one-off dip. For latency-sensitive metrics like response time, use percentiles (for example, the 90th-percentile response time) rather than averages, since averages mask outliers. And contextualize alerts by traffic volume: a high response time during a quiet Tuesday morning carries less urgency than the same reading on a Saturday afternoon during a property launch.
How do you implement a dashboard in a Singapore real-estate team?
Implementation checklist:
Identify data sources: Sales+ app, your CRM, WhatsApp/email logs, client survey tool, and ERA’s training portal.
Set ingestion frequency: real-time for response time and lead contacts; daily batch for conversion and CSAT.
Configure alerts: map warning and critical thresholds from Section 4 into your dashboard tool’s alert settings.
Assign roles: one agent owns daily self-checks; the team leader owns weekly reviews and coaching documentation.
Test with two weeks of historical data before going live, so baseline values are populated from the start.
Document PDPA compliance: record what data is collected, the retention period, and the consent mechanism.
Role | Daily Task | Weekly Task | Governance |
Agent | Check operational view; log contacts | Review conversion trend with team leader | Update Sales+ activity daily |
Team leader | Monitor trigger alerts | Run coaching session; document interventions | Archive coaching notes; review PDPA log |
Admin | Verify data ingestion | Audit retention and consent records | Report anomalies to team leader |
ERA team leaders should store coaching intervention notes in a shared folder accessible to the agent, creating a transparent record that supports both performance improvement and CEA conduct standards.
How ERA and the Sales+ app support your dashboard from day one
ERA’s Sales+ app is the practical engine behind the dashboard for new agents. It logs outreach attempts, appointment outcomes, and listing presentations automatically, removing the manual data-entry burden that derails most early-career tracking efforts. ERA’s structured training pathways, including the RES exam preparation modules and team-leader programs, feed the training-completion KPI directly.
Benefits for new agents using ERA’s dashboard-connected workflow:
Faster ramp time: coaching interventions happen within days of a threshold breach, not at the end of the month
Clear progress signals: agents see their own conversion trend before the team leader raises it, building self-awareness
Measurable path to licensure: training completion and exam-readiness KPIs keep the CEA timeline visible
Donny Lee’s leadership approach centers on making performance visible and coaching specific. The dashboard is the tool that makes both possible.
Pro Tip: Connect your Sales+ app to your dashboard in week one, even if your KPI targets are not yet finalized. Live data from the first two weeks becomes your personal baseline, which is more accurate than any industry average.
Your 30/60/90-day quick-start plan
Days 1–30 (Foundation):
Import contacts into Sales+ and log a minimum of 10 outreach attempts in week one.
Set personal baselines from your first two weeks of activity data.
Agree on warning and critical thresholds with your team leader by day 14.
Complete at least 50% of ERA’s onboarding training modules.
Days 31–60 (Momentum):
Hit your first appointment metric: at least three confirmed appointments by day 45.
Review your weekly coaching view with your team leader every Friday.
Track your lead-to-appointment conversion rate and identify one specific skill gap to address.
Complete remaining training modules; target 90% completion by day 60.
Days 61–90 (Performance):
Aim for at least one listing presentation per week.
Adjust thresholds upward if you are consistently exceeding targets — static thresholds stop being useful once you outgrow them.
Document two coaching interventions with your team leader, including the trigger that prompted each one.
Agents vs. team leaders:
Agents record daily: contacts made, response times, and appointment outcomes in Sales+
Team leaders review weekly: conversion trends, training completion, and trigger-alert history
In high-volume Singapore districts (Orchard, Marina Bay, Jurong), tighten warning thresholds by 15–20% during peak launch periods; in lower-volume areas, widen them to avoid alert fatigue
For new agents joining ERA, the 30/60/90 plan maps directly onto ERA’s onboarding milestones, so the dashboard and the training program reinforce each other from the start.
Key Takeaways
A focused agent performance dashboard with a limited number of KPIs, named owners, and trigger thresholds is an effective way for new Singapore real-estate agents to shorten ramp time and keep RES exam preparation on track.
Point | Details |
Limit to 6–12 KPIs | More than 12 metrics slow decisions; fewer than 6 miss critical signals. |
Every KPI needs three anchors | Set a current value, a baseline, and a target before you configure any alert. |
Triggers require named owners | A warning threshold without an assigned owner produces no action. |
PDPA guardrails are non-negotiable | Collect only agent-activity data, apply a 12-month retention limit, and document consent. |
Myeracareer and ERA’s Sales+ app | Connect Sales+ in week one to build a personal baseline and activate ERA’s coaching workflow. |
What dashboards actually changed about recruiting and onboarding
Before we adopted a structured performance tracking dashboard on our team, coaching was largely reactive. A new agent would go three or four weeks without hitting appointment targets, and by the time the pattern surfaced in a monthly review, momentum had already stalled. The agent felt discouraged, and the intervention required significantly more effort than it would have needed earlier.
The shift came when we wired trigger thresholds into our weekly review cadence. One recruit, early in her onboarding, had strong lead-contact numbers but a conversion rate that was dropping week over week. The dashboard flagged it as a warning on day 18. We sat down the following morning, reviewed her call notes together, and identified a specific objection she was not handling confidently. Two weeks later, her conversion rate had recovered. Without the threshold alert, that conversation would have happened at the 45-day mark, if at all.
Dashboards do not replace the coaching relationship. They make it more precise. The data tells you where to look; the conversation determines what to do. For team leaders running ERA’s experienced-agent programs, that combination of live signal and structured coaching is what separates a team that scales from one that plateaus.
Ready to build your ERA career with the right tools behind you?
Myeracareer gives you a structured path into Singapore real estate, backed by ERA’s Sales+ app, a proven onboarding framework, and Donny Lee’s hands-on leadership program. The difference from going it alone is not just access to tools. It is having a team leader who reviews your dashboard with you every week and coaches to the specific signals your data surfaces.

Whether you are preparing for your RES exam or considering a move from another agency, Myeracareer connects you to ERA’s full onboarding infrastructure from day one. New agents can explore the full onboarding pathway and see exactly what the first 90 days look like. If a leadership track interests you, the team-leader program details are a practical next step. Schedule a conversation with Donny’s team and bring your questions about KPIs, Sales+, and what your first month will actually look like.
Useful sources and Singapore resources
Source | What it covers | Best for |
Build a Business Performance Dashboard That Drives Decisions | KPI count, baselines, ownership, and trigger design | Dashboard architecture and threshold-setting |
Agent performance dashboard metrics and workflows | Common agent metrics: response time, CSAT, request count | Selecting and defining individual KPIs |
What is a Performance Dashboard — insightsoftware | Metric segmentation by financial, operational, and customer categories | Balancing your KPI scorecard |
Monitor agents with the Agent Monitoring Dashboard — Microsoft Learn | Telemetry, latency, alert configuration, dynamic thresholds | Implementation and alert tuning |
PDPA obligations, data minimization, consent requirements | PDPA compliance for agent tracking | |
RES exam requirements, licensing, and conduct standards | Regulatory compliance for new agents | |
Myeracareer — New Agents | ERA onboarding pathway, RES exam support, Sales+ app | Starting your Singapore real-estate career |
Myeracareer — About Donny Lee | Author biography, team-leader expertise, ERA leadership pathway | E-E-A-T verification and leadership context |
Additional reading:
For rental-specific KPIs relevant to agents handling residential leasing, rental property KPI guidance offers a practical complement to the core dashboard set above
For real-time inquiry tracking examples applicable to agent dashboards, rental inquiry tracking illustrates how live alert systems work in property contexts
CEA’s public register and conduct guidelines are the authoritative source for any question about licensing eligibility or professional conduct obligations in Singapore
This article provides general information about dashboard design and performance tracking for real-estate agents. It is not legal or regulatory advice. Confirm current CEA licensing requirements and PDPA obligations with the relevant Singapore authorities or a qualified professional for your specific situation.
Recommended
Comments